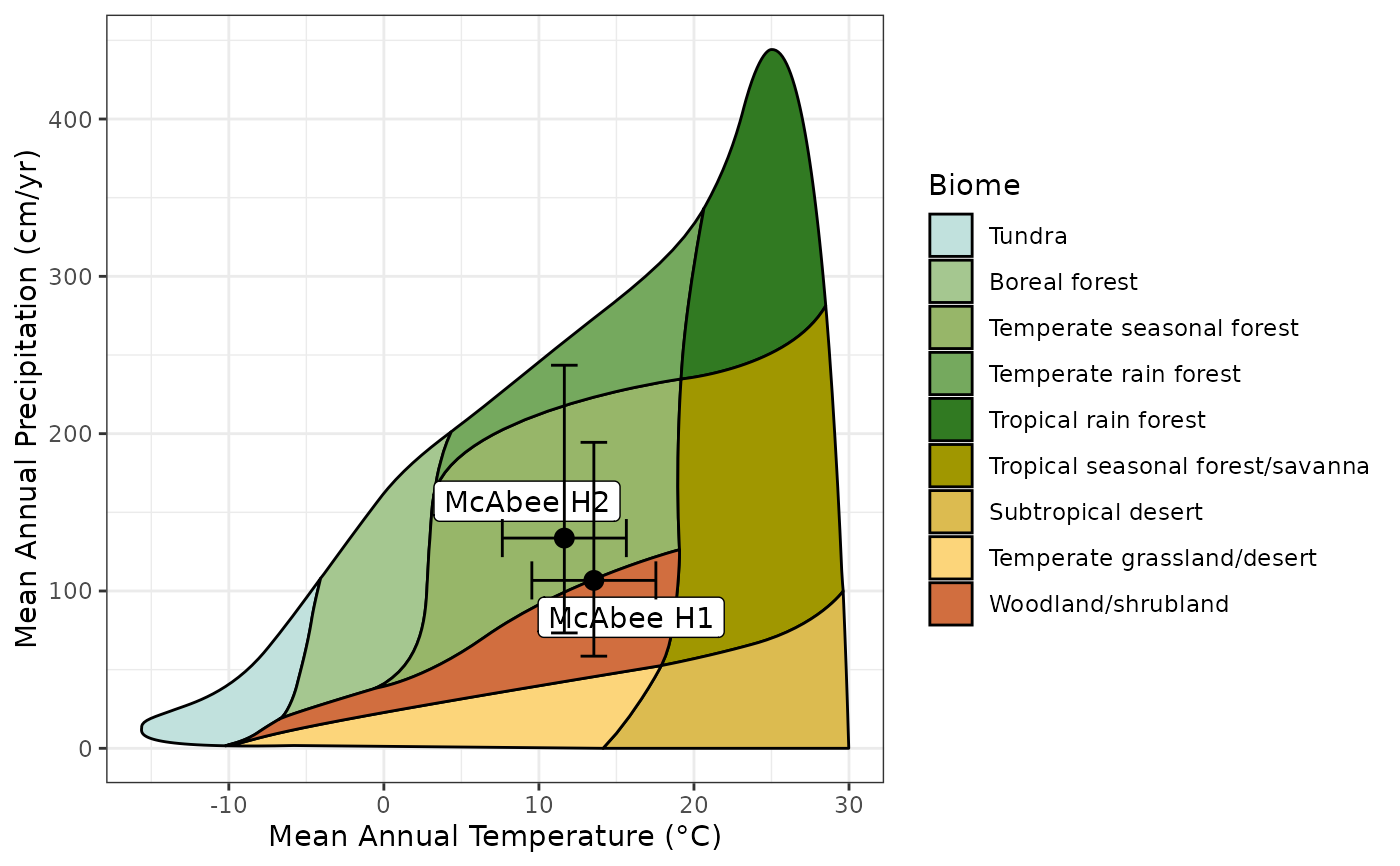
dilp_whittaker() plots dilp() outputs onto a Whittaker Biome plot. Base
Whittaker Plot from the plotbiomes
package by Ștefan Valentin and Sam Levin.
Arguments
- climate_data
A data frame containing either the direct output of a
dilp()call, or the $results tab from that output. Can also be a data frame with the following required columns:site
MAT.MLR
MAT.MLR.error
MAP.MLR
MAP.MLR.error.minus
MAP.MLR.error.plus
References
Valentin Ștefan, & Sam Levin. (2018). plotbiomes: R package for plotting Whittaker biomes with ggplot2 (v1.0.0). Zenodo. https://doi.org/10.5281/zenodo.7145245
Examples
results <- dilp(McAbeeExample)
#> Warning: Outliers found. Please evaluate $outliers for possible wrong measurements
dilp_whittaker(results)